Anomaly Detection
- Detect anomalies using range-based filtering and business logic
- Create derived columns to surface hidden anomalies in data
- Visualise outliers using box plots and identify suspicious distributions
- Understand and apply z-scores and the empirical rule to identify statistical outliers
- Distinguish between legitimate business anomalies and data errors
- Investigate categorical data for suspicious patterns and inconsistencies
- Use measures of dispersion (standard deviation, quartiles, range) to assess data quality
- Communicate anomaly detection findings to stakeholders using visualisations
Pre work
Set up
If nobody has done so already, copy and paste this command into Slack.
/prework Anomaly Detection
Task
Using your cleaned_regional_data.csv from the Pandas workshop (or by downloading a clean copy here), answer the following questions in the Slack thread:
- What are the highest and lowest ticket prices in the dataset?
- What is the average number of tickets sold per sale?
- How many rows are in the data?
- What is the second most popular event category name by number of sales?
Workshop
Elicit questions about the prework
Present the following problem
One member of the Box Office team has flagged some concerns about the regional
ticketdata we've been working with in our Pandas workshop. Before we use it for any meaningful analysis, we need to check it for anomalies — strange values, impossible numbers, suspicious patterns.She's asked us to look through the event and sales data and identify anything that doesn't look right. Only once we're confident in the data can we trust the insights we draw from it.
Define what an anomaly is in data
An anomaly is an instance or collection of data points whose features differ significantly from most of the data
In simpler terms, it is data that is wildly different from the rest of the dataset
Ask trainees why detecting and removing anomalies is important
Anomalies will skew the dataset and reduce the accuracy of the insights we draw from the data
For example, if we have a list
[1, 2, 4, 2, 1, 4, 5, 3, 1, 10000000]The average of this would be1000002and is clearly not representational of the dataset. However, by ignoring theoutlier, the average becomes ~2.56, which feels more accurate for the majority of the data.
Load the events data using pandas
import pandas as pd
import altair as alt

alt.data_transformers.enable("vegafusion")

events = pd.read_csv("cleaned_regional_data.csv")
events.info()
Highlight the column names and types — most of the sales-related columns are numerical, which is what we need for statistical anomaly detection.
Point out that the data is already cleaned (from the Pandas workshop), but cleaned data can still contain statistical anomalies — values that are mathematically possible but don't make business sense.
Point out that there is a more useful method to learn more about numerical columns
events.describe()
Talk through the various information available
- count: the number of non-null values
- mean: the average of the values
- std: the standard deviation (meaning the average amount of difference from the mean)
- min: the minimum value
- 25%: the first quartile
- 50%: the second quartile
- 75%: the third quartile
- max: the maximum value
Explain that all of these values are useful for finding erroneous data.
Ask trainees what looks suspicious in the .describe() output
Possible issues to spot:
- Is the minimum
pricepaidandqtysoldreasonable? (should be >= 0)- Is the maximum
pricepaidreasonable? (extreme outliers?)- Is there a massive gap between the 75th percentile and the max for any column?
Range-based Filtering
Start to clean the data.
Ticket prices should be positive. A price of 0 means no sale happened, but negative prices shouldn't exist. Similarly, qtysold should never be negative.
# Filter out any rows with negative ticket prices
events = events[events["pricepaid"] >= 0]
events = events[events["qtysold"] >= 0]

events.describe()
Derived Columns for Deeper Analysis
Explain that creating new columns can help surface anomalies that aren't visible in the raw data.
Let's calculate the price per ticket for each sale to see if anything looks off.
# Avoid division by zero
sales = events[events["qtysold"] > 0].copy()
sales["price_per_ticket"] = sales["pricepaid"] / sales["qtysold"]
sales["price_per_ticket"].describe()
Ask trainees: are there any events with suspiciously high ticket prices?
Discuss whether these are real outliers or just premium events — this is a judgement call. In this case, choose 1000 as the upper limit to account for VIP/Charitable events and amend the values using range.
sales = sales[(sales['price_per_ticket'] >= 0) & (sales['price_per_ticket'] <= 1000)]
sales["price_per_ticket"].describe()
Ask trainees: does anything jump out? Are there ticket prices that seem impossibly high or low?
Visual Anomaly Detection
Shift focus to visual methods of anomaly detection.
Live code a box and whiskers chart to find outliers in ticket prices by catname.
alt.Chart(sales).mark_boxplot().encode(
    y="catname:N",
    x="price_per_ticket:Q",
    tooltip=["eventname:N", "catname:N", "price_per_ticket:Q"]
).properties(
    width=1000,
    height=200,
    title="Price per Ticket by Event Category")
Point out that some categories may have a much wider spread than others.
Discuss whether the outliers are genuine premium events or data errors — this is the core skill of anomaly detection.
Ask the trainees their opinion of whether or not to remove them
There is only one ticket sold at 1000 and whilst it was for an opera production it appears to be an outlier as it is unlikely that it was part of a larger, pricier event.
Adjust our filter on price_per_ticket to remove the 1000 entirely and re-render the chart.
sales = sales[(sales['price_per_ticket'] >= 0) &
              (sales['price_per_ticket'] < 1000)].copy()
Discuss with trainees whether the remaining outliers here are concerning or expected.
The outliers at the higher price levels are all Christmas-based shows, or "Evita". These might indicate high pricing surges due to the time of year, or the popularity of a specific production.
The outliers at a lower level should be investigated further, as they still look far too low, and some are still coming in with a
price_per_ticketlevel of 0!
Statistical Anomaly Detection: Z-Scores
Introduce the concept of z-scores
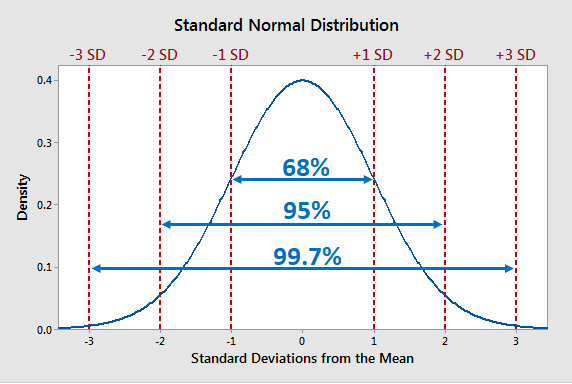
To find outliers in a dataset, we can use standard deviation. Standard deviation is a measure of how spread out or close together the data is to each other. The closer the data is to each other, the lower the standard deviation. In a dataset, we describe a standard deviation as a unit and measures in n number of deviations
In a standard normal distribution (a bell curve), around 68% of the data lies within one standard deviation, or a
z-score(the number of standard deviations away from the mean a datapoint is) of +/- 1, from the mean, and about 95% within two standard deviations (z-score of +/- 2). Approximately 99.7% of data points fall within three standard deviations (z-score of +/-3) from the mean, often referred to as the "68-95-99.7 rule" or the "empirical rule."
In plain English, this means that 99.7% of all the data should be within 3 standard deviations from the average. By removing all data points beyond this, we can remove most, if not all of the outliers in the data. One caveat is that if more than 0.3% of the data are outliers, they will remain.
Add the import for zscore from the scipy.stats library as well as numpy
from scipy.stats import zscore
import numpy as np
Calculate the z-score for price_per_ticket
sales["price_zscore"] = zscore(sales["price_per_ticket"])
Set the threshold for the z-score to 3 to remove outliers
z_threshold = 3
Filter the outliers by using the absolute value of the z-score:
clean_sales = sales[sales["price_zscore"].abs() < z_threshold].copy()
Notice that after z-score filtering, Evita, The Nutcracker and A Christmas Carol are still present. They weren't removed because their prices fit a real distribution—they're not errors, they're just expensive events. The question now becomes: why?
Anomaly Detection: Relationship Patterns
Explain that some anomalies only appear when you look at multiple variables together.
So far, we've looked at individual columns in isolation. But sometimes the anomaly isn't in a single value—it's in the relationship between values.
For example, a £0 price might be normal for a small amount of tickets given away. But £0 price combined with a large quantity sold (300+ tickets) is suspicious—that suggests something unusual happened (preview night, cancelled event, or data error).
Live code a scatter plot showing the relationship between price and quantity:
alt.Chart(clean_sales).mark_circle().encode(
    x="price_per_ticket:Q",
    y="qtysold:Q",
    color="catname:N",
    tooltip=["eventname:N", "catname:N", "price_per_ticket:Q", "qtysold:Q"]
).properties(
    width=800,
    height=400,
    title="Price per Ticket vs Quantity Sold"
)
Point out the patterns visible here that weren't as obvious in the box plots.
- Top-right cluster: Evita and Christmas Carol with both high prices AND high quantities, these are likely legitimate premium events.
- Bottom band: Some points with £0 prices but varying quantities—this is suspicious and needs investigation
- General pattern: Most events cluster in the middle area, showing typical pricing and quantities
Task trainees to investigate the £0 price rows:
Filter
clean_salesfor rows wherepricepaid == 0and examine them. What events have free tickets? Are these legitimate business scenarios (like free previews or press nights) or data quality issues that should be removed?
free_tickets = clean_sales[clean_sales["pricepaid"] == 0]
free_tickets[["eventname", "catname", "qtysold", "pricepaid"]]
Discuss the patterns that emerge:
- All £0 tickets are for major musicals and premium events
- Quantities sold are substantial (270-671 tickets), not tiny quantities
- This suggests preview nights, press previews, or complimentary performances rather than data errors
- These are legitimate business scenarios worth investigating further
Event-Level Anomalies: Understanding Premium Pricing
Explain that the Evita, Nutcracker, and Christmas anomalies deserve deeper investigation.
We've identified that these events consistently have high prices. Before deciding whether to keep or remove them, we should understand why. Are they intentionally priced higher? Is there a business reason? Or is there a data quality issue?
Which events have the highest average prices?
mean_prices = clean_sales.groupby("eventname")["price_per_ticket"].mean()
counts = clean_sales.groupby("eventname").size()
event_stats = pd.DataFrame({'mean': mean_prices, 'count': counts}).sort_values('mean', ascending=False)
print(event_stats.head(10))
Discuss the findings:
- Evita, The Nutcracker, and A Christmas Carol consistently have the highest average prices
- These premium events maintain high prices across all seasons
- This strongly suggests intentional pricing strategy, not a data error
- The Nutcracker's pricing is particularly consistent (a controlled, seasonal event)
- Question: Is this a legitimate business decision (premium events, holiday pricing) or an anomaly worth removing?
Extend the investigation: Venue and seasonal patterns.
# Create season column and investigate
clean_sales["starttime"] = pd.to_datetime(clean_sales["starttime"])
clean_sales["month"] = clean_sales["starttime"].dt.month
clean_sales["season"] = clean_sales["month"].apply(
    lambda m: "Winter" if m in [12, 1, 2]
    else "Spring" if m in [3, 4, 5]
    else "Summer" if m in [6, 7, 8]
    else "Fall")

# Focus on the identified premium events: are they expensive year-round or seasonal?
top_events = ["Evita", "A Christmas Carol", "The Nutcracker"]
premium_seasonal = clean_sales[clean_sales["eventname"].isin(top_events)]
print(premium_seasonal.groupby(["eventname", "season"])["price_per_ticket"].mean())
Conclude the investigation
The key anomaly detection skill isn't just finding outliers—it's understanding them. Evita and Christmas Carol are anomalies in price, but they may be legitimate business anomalies (premium events with intentional higher pricing) rather than data errors. Your job as an analyst is to investigate, gather evidence, and communicate findings to stakeholders to determine whether to keep, adjust, or remove them from analysis.
Final task: Investigate the £0 prices
Task trainees to dig deeper into the £0 price anomaly:
Now that you've learned multiple anomaly detection methods, apply them to understand the £0 price phenomenon: Are these all legitimate business decisions, or do you find any that should be removed from analysis? Use the
cancelledcolumn to help investigate.
# How many of the £0 price rows are from cancelled events?
free_cancelled = free_tickets[free_tickets["cancelled"] == 1]
free_legitimate = free_tickets[free_tickets["cancelled"] == 0]

print(f"Total £0 price rows: {len(free_tickets)}")
print(f"Cancelled events (£0): {len(free_cancelled)}")
print(f"Legitimate previews (£0): {len(free_legitimate)}")
print("\nCancelled events with £0 price:")
print(free_cancelled[["eventname", "qtysold", "cancelled"]])
Discuss the findings:
- Cancelled events (11 rows): These £0 prices represent performances that never happened. They should likely be removed from analysis as they don't reflect real business transactions
- Legitimate previews (37 rows): These are intentional business decisions to offer free preview performances. They should stay in the dataset to represent the full picture of ticket activity
- Key lesson: An anomaly isn't always an error. Context (the
cancelledcolumn) completely changes the interpretation- Final takeaway: This illustrates the most important principle in anomaly detection—investigate before you decide. Context changes everything.